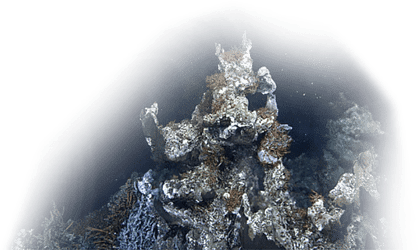
Beneath the ocean floor, bacteria produce methane gas that is regularly released up through the sediment and into the sea water as bubble streams (Figure 1). While these gas flares have been observed on continental margins around the world, until now there has been no systematic study of all available gas flow observation data to estimate the total amount of methane escaping from the seafloor. These data are important for the global inventory of carbon and also for analyzing the uptake of carbon dioxide (ocean acidification), and its impact on climate change.
Figure 1: Methane gas bubbles escaping the seafloor near Clayoquot Slope.
In a new study recently published in Nature.com, researchers in Germany and Canada have now analyzed all available historic and recent gas bubble data from the Cascadia margin off British Columbia, Washington and Oregon (Figure 2).
Figure 2: Regional map of the Cascadia margin showing flare distribution and gas bubbling flow rate. The size of the blue circles is proportional to the gas flow rate; black circles show vent sites without flow estimates. (Credit: Nature Communications)
Lead by GEOMAR’s Dr. Michael Riedel with his local colleagues in Kiel, along with researchers at MARUM Center for Marine Environmental Sciences and Department of Geosciences at University of Bremen, Ocean Networks Canada and the University of Victoria, the study used ship-based acoustic surveys of the water column, as well as near-seafloor acoustic and visual data. They gathered over 1100 vent sites with over 430 gas flow estimates for the entire Cascadia offshore margin.
ONC scientists Martin Scherwath and Martin Heesemann contributed to the research by providing ONC data⎯including ship-based acoustic data, underwater video and seafloor multi-beam sonar data⎯as well as helping to interpret and statistically summarize the data, and writing the manuscript.
Figure 3. Examples of acoustic data showing gas venting. (a) Gas flare in ~120 metres water depth from expedition FK009A (EK60), (b) example of flares in ~85 metres water depth from expedition MF0903 (EK60), (c) example of a flare in ~920 metres water depth from expedition ONC2014 (EK60), and (d) fan-view of EM302 data of flares in ~1335 metres water depth from expedition Naut2016. (Credit: Nature Communications)
“With so many ship surveys and relevant data sets readily available across the Cascadia margin (Figure 3), we just had to go ahead with the study and reveal where all the undiscovered vents were and how much the total gas flux was likely to be.” comments ONC’s Martin Scherwath.
Since 2010, ONC has deployed multi-beam sonar instruments at Clayoquot Slope to study plumes of methane bubbles escaping from the seafloor. Previous research has monitored the bubble fluctuations at this site, but it is practically impossible to observe an entire margin's methane activity at all times. In order to obtain a gas flux estimate for the whole region, the existing observations were extrapolated in space and time to estimate gas activity over the entire margin, even at places where no data exist.
“While this estimate has large uncertainties,” says Martin Scherwath ”the research suggests that for every square metre of seafloor, about one gram of methane is bubbling up every year. This amounts to 100,000 tonnes of methane escaping the sediments into the ocean in offshore Cascadia every year.”
The existing observations at the Cascadia margin indicate that all of the gas is dissolving in the ocean, which means it is not escaping into the atmosphere where methane would act as a powerful greenhouse gas. Rather, its ocean dissolution is exacerbating ocean acidification.
