Tom, during a 2013 expedition to visually survey Axial Seamount with the Monterey Bay Aquarium Research Institute
Many of our colleagues are oceanographers, ocean scientists, biologists, geophysicists, etc. How would you describe your specialized profession?
I would say I am a deep sea volcanologist, seafloor surveyor and science visualizer.
Did you have a moment in your childhood when you knew what professional direction your life would take? Did you have a “fall in love with the ocean” moment?
I probably have to cite the usual influences like 20,000 Leagues Under the Sea, Jacques Cousteau, and Bob Ballard (yes, I am that young). But I knew pretty much at age 15 that I wanted to do what I do now.
What path led you to choose robotics and data visualization (projected video environments/virtual reality/3D photogrammetry) in a marine environment?
First, I wanted to be a submarine engineer, but I am bad at math. Then I wanted to become a submarine captain, but naval subs have no windows. So I ended up as a scientist, which is more agreeable and I got those windows.
You have a variety of exciting research interests. Is there a central theme that links them all?
My goal is to provide the highest possible detail of the seafloor. Doing so seems to be most rewarding at deep sea volcanoes.
What makes you most excited about your research, or your future direction?
The great challenge we still face in marine geology is to actually transport ourselves to the seafloor. We now recreate the marine environment in virtual simulators that finally give us a feeling of our presence down there.
The ARENA simulator at GEOMAR in Kiel, Germany, surrounds the viewer with projected images that create a virtual deep sea environment.
What brings you to Ocean Networks Canada and the west coast of Canada?
The fact that ONC has yearly scheduled expeditions to the study sites is pretty unique and offers the chance to really exploit the potential of our high-resolution maps. At the same time, we can repeat those high-resolution surveys and follow intricate developments over time.
How have you used Ocean Networks Canada data and infrastructure to assist your research?
I went through ONC’s 2014 remotely operated vehicle video archives to identify past surveys that may be integrated and compared with this year’s extensive surveys. It was good preparation for the 2015 expedition that would be my first comprehensive mapping of key seafloor study sites using photogrammetry.
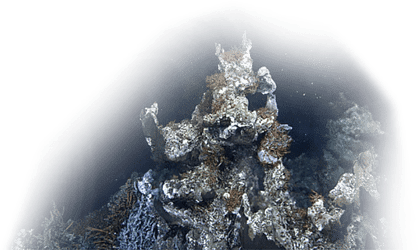
Tom’s 3D model of the Faulty Towers hydrothermal vent group on the Juan de Fuca ridge (from ONC 2014 data).
What was it like to be working aboard the E/V Nautilus, during Wiring the Abyss 2015?
It was awesome! The crew, the ship, even the weather was great, and we accomplished an impressive amount of photogrammetry: 46 hours and 22 minutes’ worth. That was spread over three dives and three major vent sites. The images were recorded in high-definition video that I then resampled at 1 image per second intervals. In all, about 100,000 images will be processed, separated into subprojects for the individual vent groups. We will start with the High Rise vent, and first results can be expected early next year. Our hope is that we will then use the models together with geologists and biologists in Canada and Germany to create 3D geological and habitat characterizations.
Tom oversees a photographic survey from the E/V Nautilus control room during one of the ROV dives at Endeavour.
Where do you see your research or research interests five years from now?
A tough question I ask myself every morning! I would like to be able to create larger maps, possibly using unsupervised hovering autonomous underwater vehicles or AUVs, but most importantly we have to prove what a great added value lies in photographic mapping and the virtual fieldwork taking place on the seafloor.
Read Tom's paper: Doing fieldwork on the seafloor: Photogrammetric techniques to yield 3D visual models
See Tom's stunning 3D images in this ONC profile video.
